Skills Management Software: Know What Your Workforce Can Do
Ask most HR teams how many people can do a given job to the standard it needs, and the answer is in a spreadsheet someone last updated before the reorganisation. CLEAR Talent keeps a skills inventory that fills itself from the assessments you already run — set against the levels each role requires, and readable by person, team, department and skill.
- Required skills and target levels
- Per role
- Proficiency levels per scale
- 3–7
- Coverage and gap reporting
- Team & department
Why most skills matrices stop being trusted
A skills matrix usually starts life as a spreadsheet: people down the side, skills across the top, a number in each cell. It is useful for about one quarter. Then people move, roles change, the ratings were mostly self-assessed in the first place, and the sheet quietly stops matching the organisation it describes.
The cost shows up when someone needs a straight answer. Which teams are thin on a capability the next project depends on? Which skills sit with one person who has just handed in their notice? Should this gap be closed by developing people or by hiring? A matrix nobody trusts cannot answer any of those, so the decision gets made on instinct.
Skills management software fixes the maintenance problem rather than the format. The grid stays the same; what changes is that it is built from current assessments against defined levels, so it is as up to date as the last review rather than the last time someone opened the file.
One library behind every skill you track
A skills inventory is only comparable across teams if everyone is rating the same thing on the same scale. In CLEAR Talent that structure is a single competency library, organised into categories and reused everywhere.
Categories you can filter by
Competencies are grouped into categories, so a skills taxonomy can separate technical, leadership and behavioural capabilities and still be read as one inventory.
Proficiency levels with behavioural indicators
Each entry has defined levels — three to seven per scale, configured by you — described through behaviour someone could observe, so a level 3 in one department means a level 3 in another.
Practical skills alongside broader competencies
The library is fully editable. A system, a procedure or a piece of equipment can sit beside communication or clinical judgement as an entry with its own levels, assessed in the same way.
A starting point rather than a blank page
Industry starter libraries are fully editable, and AI assistance helps draft new competencies and their assessment questions for your own roles. Your team decides what goes in.
Required skills per role, set once
The other half of a skills matrix is the target: what each role actually needs. Role profiles hold that requirement, so every gap in the inventory is measured against something the organisation agreed rather than against an individual manager’s expectations.
- 1
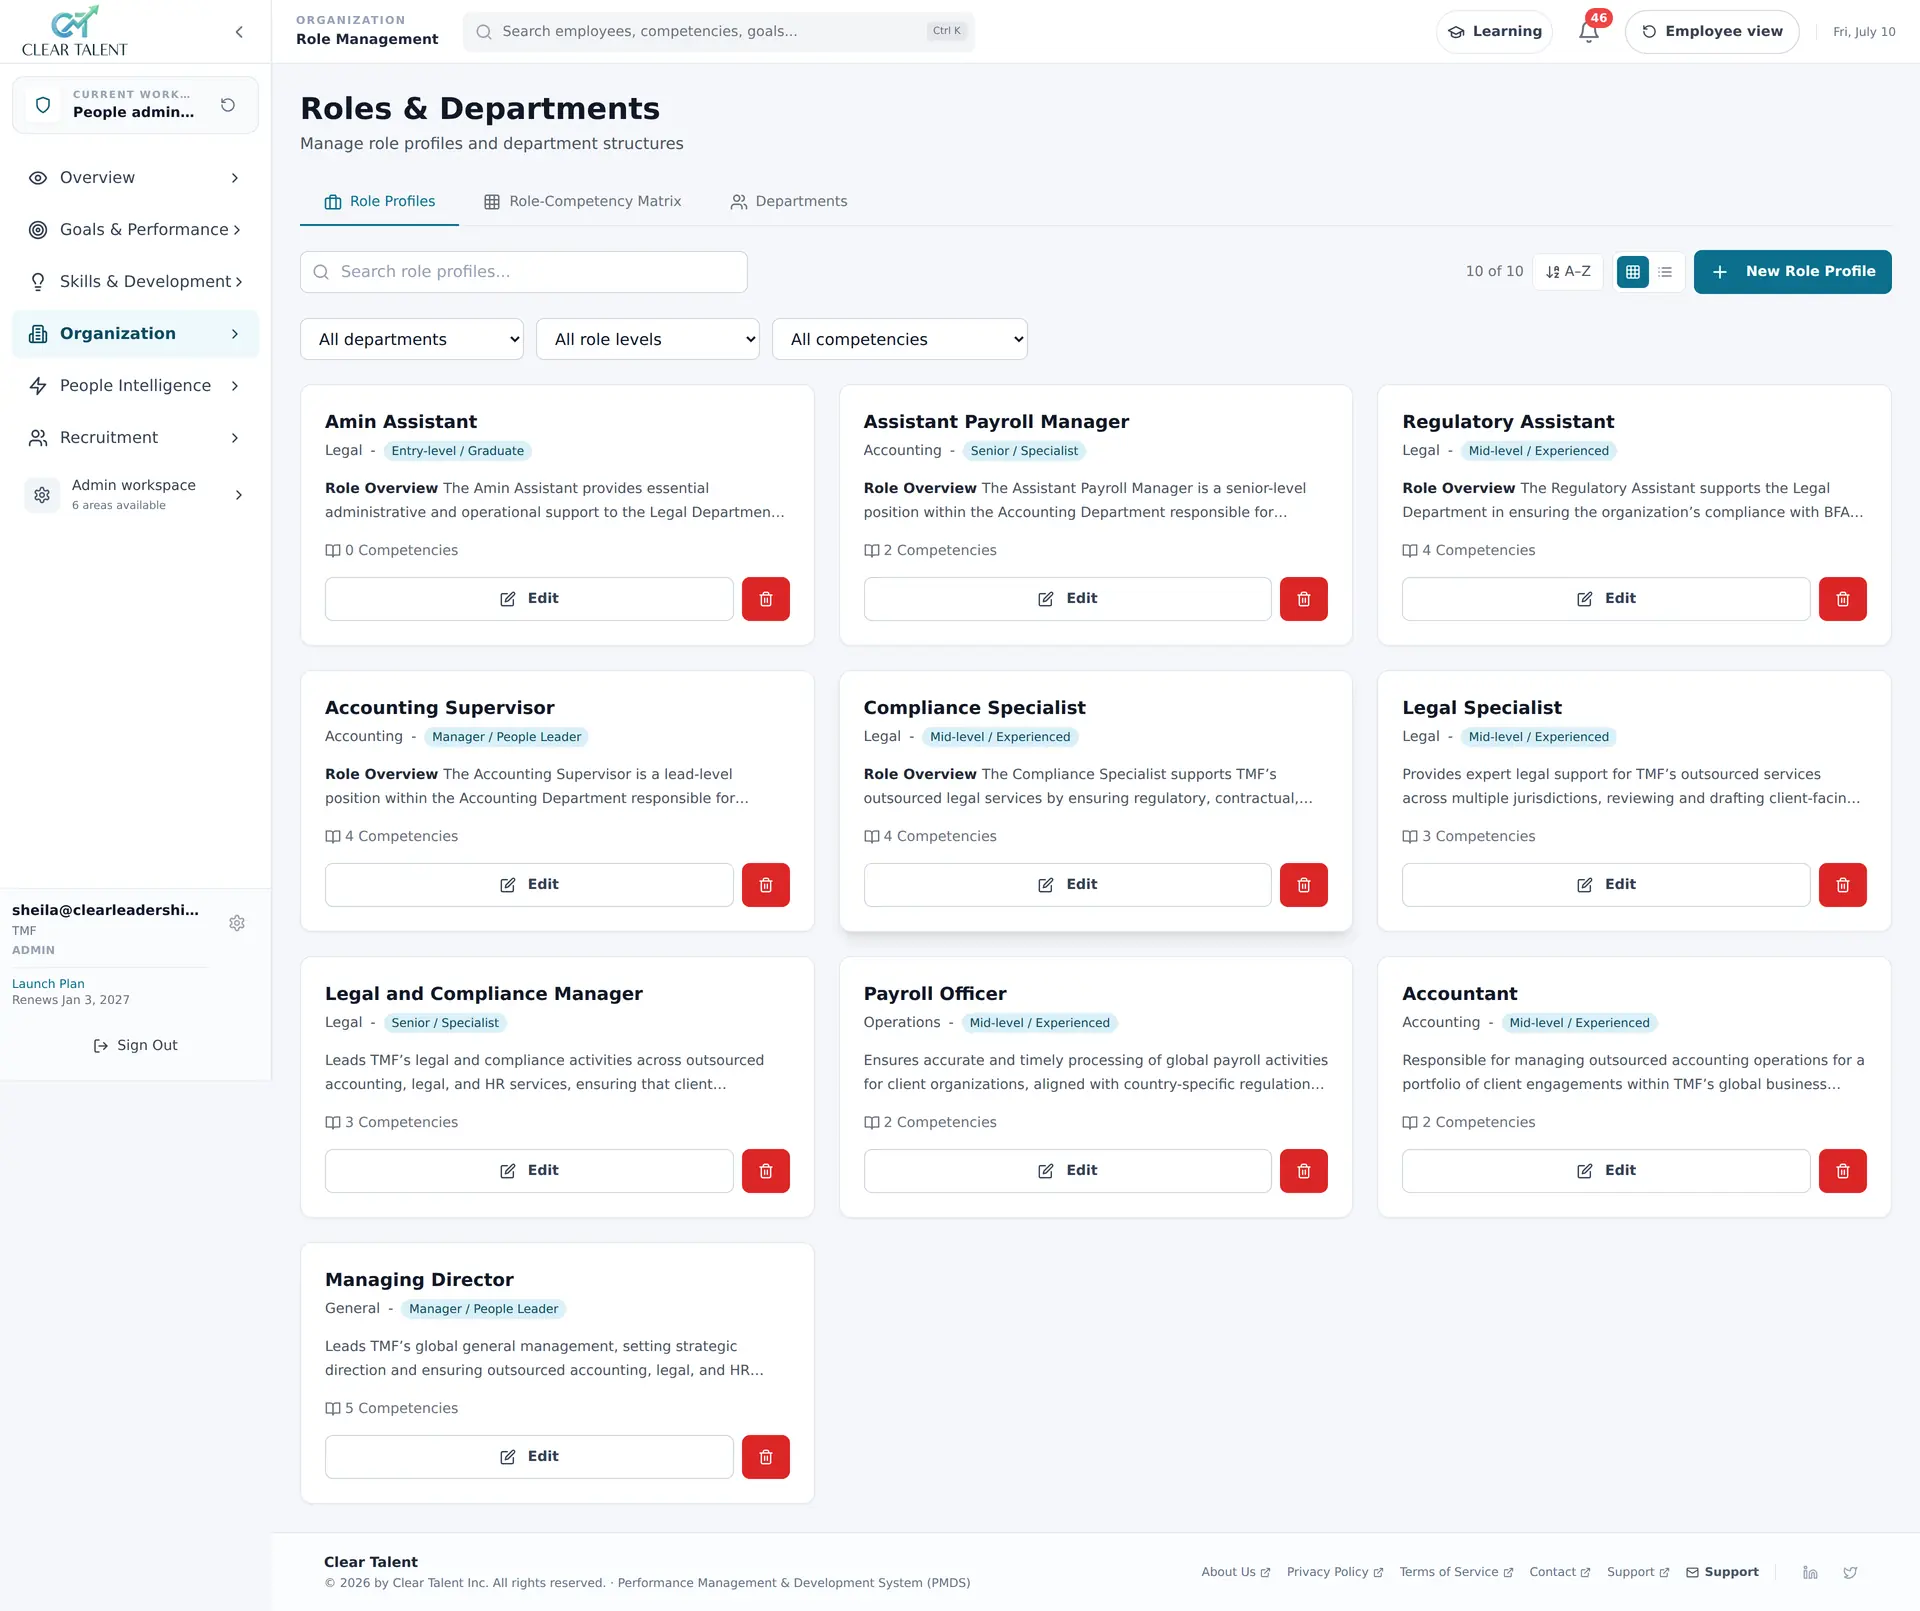
Role Profiles, Role-Competency Matrix and Departments
Three tabs over one structure: the roles themselves, the matrix setting roles against the competencies they require, and the departments they belong to.
- 2
Department, role level and competency filters
Narrow the list by department, by role level or by a single competency — the quickest way to see every role that depends on one skill.
- 3
Role level on every profile
Entry-level / Graduate, Mid-level / Experienced, Senior / Specialist and Manager / People Leader, so the same skill can carry a different target level as roles become more senior.
- 4
Competencies per role
Each card shows how many competencies the role requires. Edit opens the profile, where the requirement is maintained once and then applies to everyone in the role.
An inventory filled from assessment, not guesswork
Each cell of the matrix comes from a competency assessment against the defined levels. Self-assessment and manager assessment are compared side by side, and ratings can require supporting evidence, so a level is something that was observed rather than something someone felt confident claiming.
Because role profiles hold the target, the comparison of required against actual level is there for every person without anyone building it. When the next assessment cycle runs, the inventory moves with it — there is no separate matrix to update.
Read the matrix by person, team, department or skill
A skills matrix earns its keep when you can read it in both directions: along a row for one person, down a column for how much of a capability the organisation really has.
Individual
Required against actual level for each competency in the role, with longitudinal charts showing whether a gap is narrowing between assessments.
Team
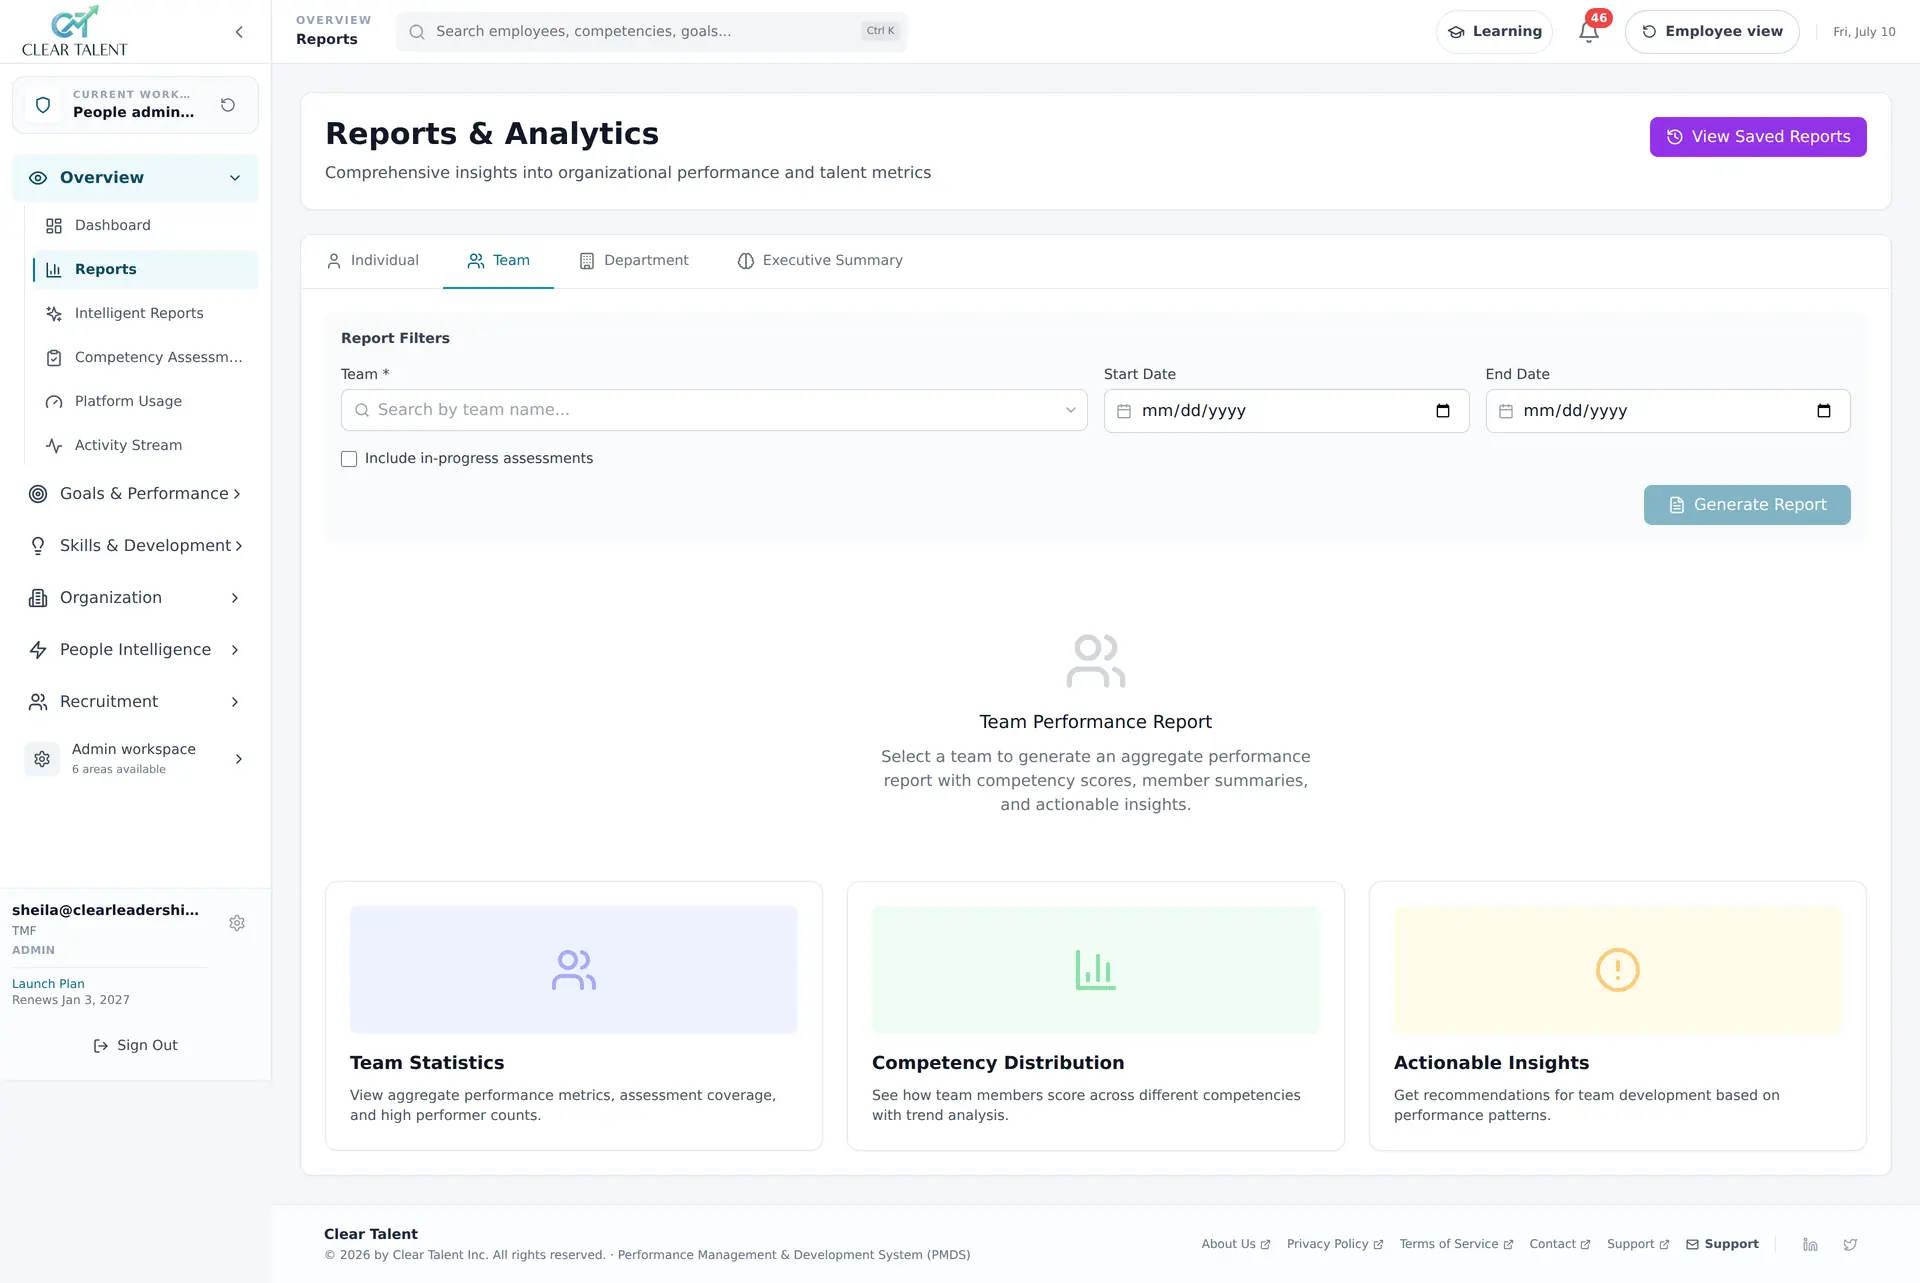
The team report shows how members score across each competency, with trend analysis, alongside assessment coverage — how many people have actually been assessed.
Department and organisation
Dashboards show capability coverage by team, department and competency, and flag the gaps, so the thin spots are visible before a project or a resignation exposes them.
Exports for your own analysis
PDF, Excel and CSV exports on every plan, plus API access, so skills data can be taken into whatever model finance or workforce planning already uses.
Skills data for the decisions workforce planning has to make
To be clear about the boundary: CLEAR Talent does not forecast headcount or model budgets. What it supplies is the half of workforce planning most organisations do not have — an accurate picture of the skills they already employ.
Read down a column and you can see where a capability depends on one or two people, which is the single-point-of-failure question every workforce plan should ask. Filter role profiles by a competency and you can see every role that depends on it, which tells you how far a shortage would reach.
The same data separates "develop" from "hire". A gap of one level across a team that is otherwise strong is a development problem with a plan attached. A capability nobody holds at any level is usually a hiring decision. And because succession readiness is calculated from the same competency data, the bench for a critical role and the skills inventory for the department are one set of evidence rather than two.
Every gap leads somewhere
A matrix that records a gap and stops there is a report. Skills-based talent management means the gap changes what happens next for the person, the team and the review.
- 1
The assessment shows the gap
Current level against the level the role requires, for each competency in the profile, confirmed by the manager rather than self-reported alone.
- 2
A development plan is drafted from it
Each assessment drafts an individual development plan around the competencies that matter most for the role, ranked by the size of the gap.
- 3
Progress is tracked between cycles
Development goals sit on the employee’s goals page and come up at check-ins, so the plan is worked on during the year rather than rediscovered at the end of it.
- 4
The next review re-scores the same skills
The same library flows into reviews and 360° feedback, so the next assessment measures on the same scale and the matrix shows whether the gap actually closed.
Building a skills matrix you will still trust next year
An illustrative sequence for a first rollout. It works best when it starts narrow and is driven by the decisions the matrix has to support.
- 1
Name the decisions first
Training budget, project staffing, succession cover or hiring — two or three of them. They decide which skills belong in the matrix and how precise the levels need to be.
- 2
Start with a handful of roles
Choose roles where a gap would hurt, set the competencies each one requires and the target level for each, and leave the rest of the organisation until the first set works.
- 3
Assess, then confirm
Self-assessment as the starting point, confirmed by the manager against the behavioural indicators. Unconfirmed self-ratings say as much about confidence as about skill.
- 4
Read the gaps and act on a few
Look down the columns for thin coverage and along the rows for individual gaps, then turn the most important ones into development plans. Extend to more roles once the first set is being used.
Related solutions
- Competency management softwareA reusable competency library with behavioural anchors, proficiency levels and skills-gap dashboards.
- Employee development and IDP softwareTurn competency gaps into individual development plans that managers track at every check-in.
- Succession planning softwareIdentify and develop successors for critical roles with 9-box grids, readiness ratings and IDPs.
- Performance management for technology companiesQuarterly OKRs, skills-based career ladders, 360° feedback and calibration for engineering and product teams.
Guides, walkthroughs and more
Frequently asked questions
Can't find what you're looking for? Talk to a specialist →
What is skills management software?
What is the difference between skills management and competency management?
Is a skills matrix the same as a competency matrix?
How many proficiency levels can a skill have?
Can CLEAR Talent support workforce planning?
How do skills gaps turn into development?
Can we bring in our existing skills matrix?
See skills management software in action.
Book a live demo with a CLEAR Talent specialist. No generic slide deck—just the platform and a conversation focused on your scenario.