Goals & alignment
Employee performance metrics and KPIs: 50 examples by function
Fifty employee performance KPIs for sales, customer support, engineering, HR and healthcare, each labelled leading or lagging, with a downloadable CSV, tests for vanity metrics and how to use KPIs in reviews and calibration.
By the CLEAR Talent team9 min read
Key takeaways
- A KPI is an ongoing measure of whether a role’s core work is healthy. It needs a definition, a data source, an owner and a target band.
- Pair lagging indicators, which confirm results, with leading indicators the person can act on during the period.
- Three to five KPIs per role is usually enough. If a number would not change a decision, drop it.
- KPIs inform a rating. They do not replace the manager’s judgement or the calibration conversation.
Most performance reviews already contain numbers. The problem is rarely a shortage of metrics. It is that nobody agreed which ones mattered, what a good result looked like or how much they should count until the review form was already open.
This guide is for HR teams and managers choosing employee performance metrics. It explains leading and lagging indicators, sets out 50 example KPIs for sales, customer support, engineering, HR and healthcare roles that you can download as a CSV, shows how to spot a vanity metric, and covers how KPIs should feed reviews and calibration without turning them into arithmetic. The examples are starting points, not benchmarks: set every target from your own baseline.
What counts as an employee performance KPI
A key performance indicator is an ongoing measure of how well a role, team or process is doing its core work. Unlike a goal, it does not finish. First-response time for a support agent or win rate for an account executive is tracked month after month, against a target band rather than a single finish line.
Metric and KPI are often used interchangeably, but the difference is useful. A metric is anything you can count. A KPI is one of the few metrics you have decided to manage, with an agreed definition, a data source, an owner and a range that counts as on track. Most teams track dozens of metrics and should hold each person to a handful of KPIs.
KPIs sit alongside goals rather than replacing them. KPIs keep the steady-state work healthy; OKRs and SMART goals describe a change someone is accountable for this period. When a KPI drifts outside its band for long enough, improving it can become a key result for a quarter.
Glossary: OKR vs KPI — how objectives, key results and KPIs fit together
Leading vs lagging indicators
Every KPI in the list below is labelled leading or lagging. The distinction decides what a manager can do with the number while the period is still running.
- Lagging indicators confirm the result
- They measure the outcome after it has happened: revenue against quota, customer satisfaction, regretted turnover. They are what the organisation ultimately cares about, but by the time they move, the period that produced them is over.
- Leading indicators predict it
- They measure the inputs and behaviours that tend to produce the outcome: pipeline coverage, backlog age, review time on pull requests. A person can influence them this week, which makes them the better subject for a check-in.
- Pair them deliberately
- For each lagging KPI a role carries, ask which leading indicator would warn you early: win rate with qualified opportunities created, first-contact resolution with quality assurance scores.
The label depends on the outcome you care about. Deployment frequency is a leading indicator of delivery health but says nothing about whether customers value the release. Write down what each KPI is meant to predict or confirm, beside its definition.
50 employee performance KPI examples by function
Ten KPIs for each of five functions, with what each one measures and whether it leads or lags. Choose three to five per role, not ten.
KPI list
Employee performance KPIs: 50 examples by function
| KPI | What it measures | Indicator |
|---|---|---|
| Sales | ||
| Pipeline coverage | Open pipeline value against the period’s quota | Leading |
| Qualified opportunities created | New opportunities meeting the agreed criteria | Leading |
| Discovery calls with a next step | First meetings ending with an agreed next action | Leading |
| CRM data completeness | Open opportunities with required fields filled in | Leading |
| Win rate | Qualified opportunities closed as won | Lagging |
| Revenue against quota | Closed revenue as a share of target | Lagging |
| Average deal size | Mean value of closed-won deals | Lagging |
| Sales cycle length | Days from qualified opportunity to close | Lagging |
| Forecast accuracy | Committed forecast compared with closed revenue | Lagging |
| Net revenue retention | Revenue kept and expanded in existing accounts | Lagging |
| Customer support | ||
| First-response time | Time from ticket creation to first human reply | Leading |
| Backlog age | Open tickets older than the agreed threshold | Leading |
| Quality assurance score | Sampled tickets scored against the support rubric | Leading |
| Knowledge articles updated | Help articles written or corrected from real tickets | Leading |
| First-contact resolution | Tickets solved without a follow-up contact | Lagging |
| Customer satisfaction (CSAT) | Post-interaction satisfaction rating | Lagging |
| Average resolution time | Time from ticket creation to solved | Lagging |
| Reopen rate | Solved tickets reopened by the customer | Lagging |
| Escalation rate | Tickets passed to another tier or team | Lagging |
| Service-level compliance | Tickets handled within the service commitment | Lagging |
| Engineering | ||
| Lead time for changes | Time from commit to running in production | Leading |
| Deployment frequency | How often changes reach production | Leading |
| Pull request review time | Time from review request to first review | Leading |
| Test coverage on changed code | Changed code covered by automated tests | Leading |
| Incident actions closed on time | Post-incident follow-ups done by their due date | Leading |
| Change failure rate | Deployments causing a failure that needs remediation | Lagging |
| Time to restore service | Time from incident start to recovery | Lagging |
| Escaped defects | Bugs found in production rather than before release | Lagging |
| Planned work delivered | Committed work completed within the iteration | Lagging |
| Availability against target | Service uptime against the agreed objective | Lagging |
| HR | ||
| Goals agreed on time | Employees with approved goals by the agreed date | Leading |
| Review cycle completion | Reviews completed by each stage deadline | Leading |
| Manager check-in cadence | One-to-ones held against the agreed frequency | Leading |
| Active development plans | Development plans with an action in progress | Leading |
| Time to fill | Days from approved vacancy to accepted offer | Lagging |
| Offer acceptance rate | Offers made that candidates accept | Lagging |
| New-hire retention at 90 days | Starters still employed after three months | Lagging |
| Regretted voluntary turnover | Leavers the organisation wanted to keep | Lagging |
| Internal fill rate | Vacancies filled by internal candidates | Lagging |
| HR query resolution time | Time to resolve employee questions and requests | Lagging |
| Healthcare | ||
| Competency assessments in date | Staff whose required assessments are current | Leading |
| Mandatory training compliance | Staff with required training completed | Leading |
| Structured handover use | Shift handovers using the agreed format | Leading |
| Records completed on time | Documentation finished within the agreed window | Leading |
| Incident and near-miss reporting | Safety reports submitted, read with context | Leading |
| Appraisal completion | Staff appraised within the last twelve months | Leading |
| Patient experience score | Feedback from patients or service users | Lagging |
| Medication audit results | Audited administrations meeting local policy | Lagging |
| Agency shift usage | Shifts covered by agency or bank staff | Lagging |
| Sickness absence rate | Working time lost to sickness | Lagging |
Several of these are team measures: attach one to an individual only where that person can influence it. The healthcare examples are workforce and process measures, not clinical guidance. Download the list as a CSV to adapt for your own roles.
How to avoid vanity metrics
A vanity metric looks good on a dashboard and changes no decision. Five tests catch most of them before they reach a review form.
- Would the number change a decision?
- If a KPI rose or fell by a fifth and nobody would do anything differently, it is a metric to watch at most, not one to hold someone to.
- Does it measure output or outcome?
- Calls made, tickets touched and lines of code are easy to count and easy to inflate. Prefer the result the activity is meant to produce, and keep an activity count only where it genuinely predicts that result.
- Can the person influence it?
- Company revenue on a recruiter’s scorecard fails this test. So does a team satisfaction score attached to one agent who handles a sliver of the volume.
- Does it have a counterweight?
- Any single KPI can be gamed. Pair speed with quality — resolution time with reopen rate, deployment frequency with change failure rate — so improving one at the other’s expense shows up.
- Is the definition written down?
- If two managers would calculate it differently, the number will be argued about at calibration instead of used. Agree the formula, the data source and the target band once, centrally.
Watch for the quiet failure too: a KPI that stays on someone’s scorecard after the work behind it has stopped. Retire it and rebalance the weights on what remains.
How to tie KPIs to reviews and calibration
KPIs make reviews more consistent only if they are agreed before the period and treated as evidence rather than the verdict. Five steps keep them in that role.
Agree KPIs and bands at the start
Set each person’s KPIs, target bands and data sources when goals are agreed, so the review measures what was asked for rather than whatever is in the report.
Weight them against everything else
Decide how much KPIs count relative to goals and competency assessment at each level. A sales role may lean on results; a team lead role usually needs more weight on how the work was done.
Review the leading indicators at check-ins
A drift discussed in month two is a coaching conversation. The same drift first raised at year end is a dispute.
Record the context behind the number
Note what moved it: a territory change, a product incident, a vacancy covered. A KPI result without context invites the wrong rating in either direction.
Calibrate the judgement, not the arithmetic
KPI results help managers compare like with like, but the question in calibration is still whether each rating is fair on the evidence. Check that the same band means the same rating across teams, and that nobody is credited or penalised for a team result they could not influence.
Be explicit about stretch targets. Stretch key results are meant to be missed sometimes, so many organisations weight committed KPIs in the rating and treat stretch results as context. Whatever you choose, say so before the period starts.
See performance management software that brings KPIs into reviews
Where CLEAR Talent fits
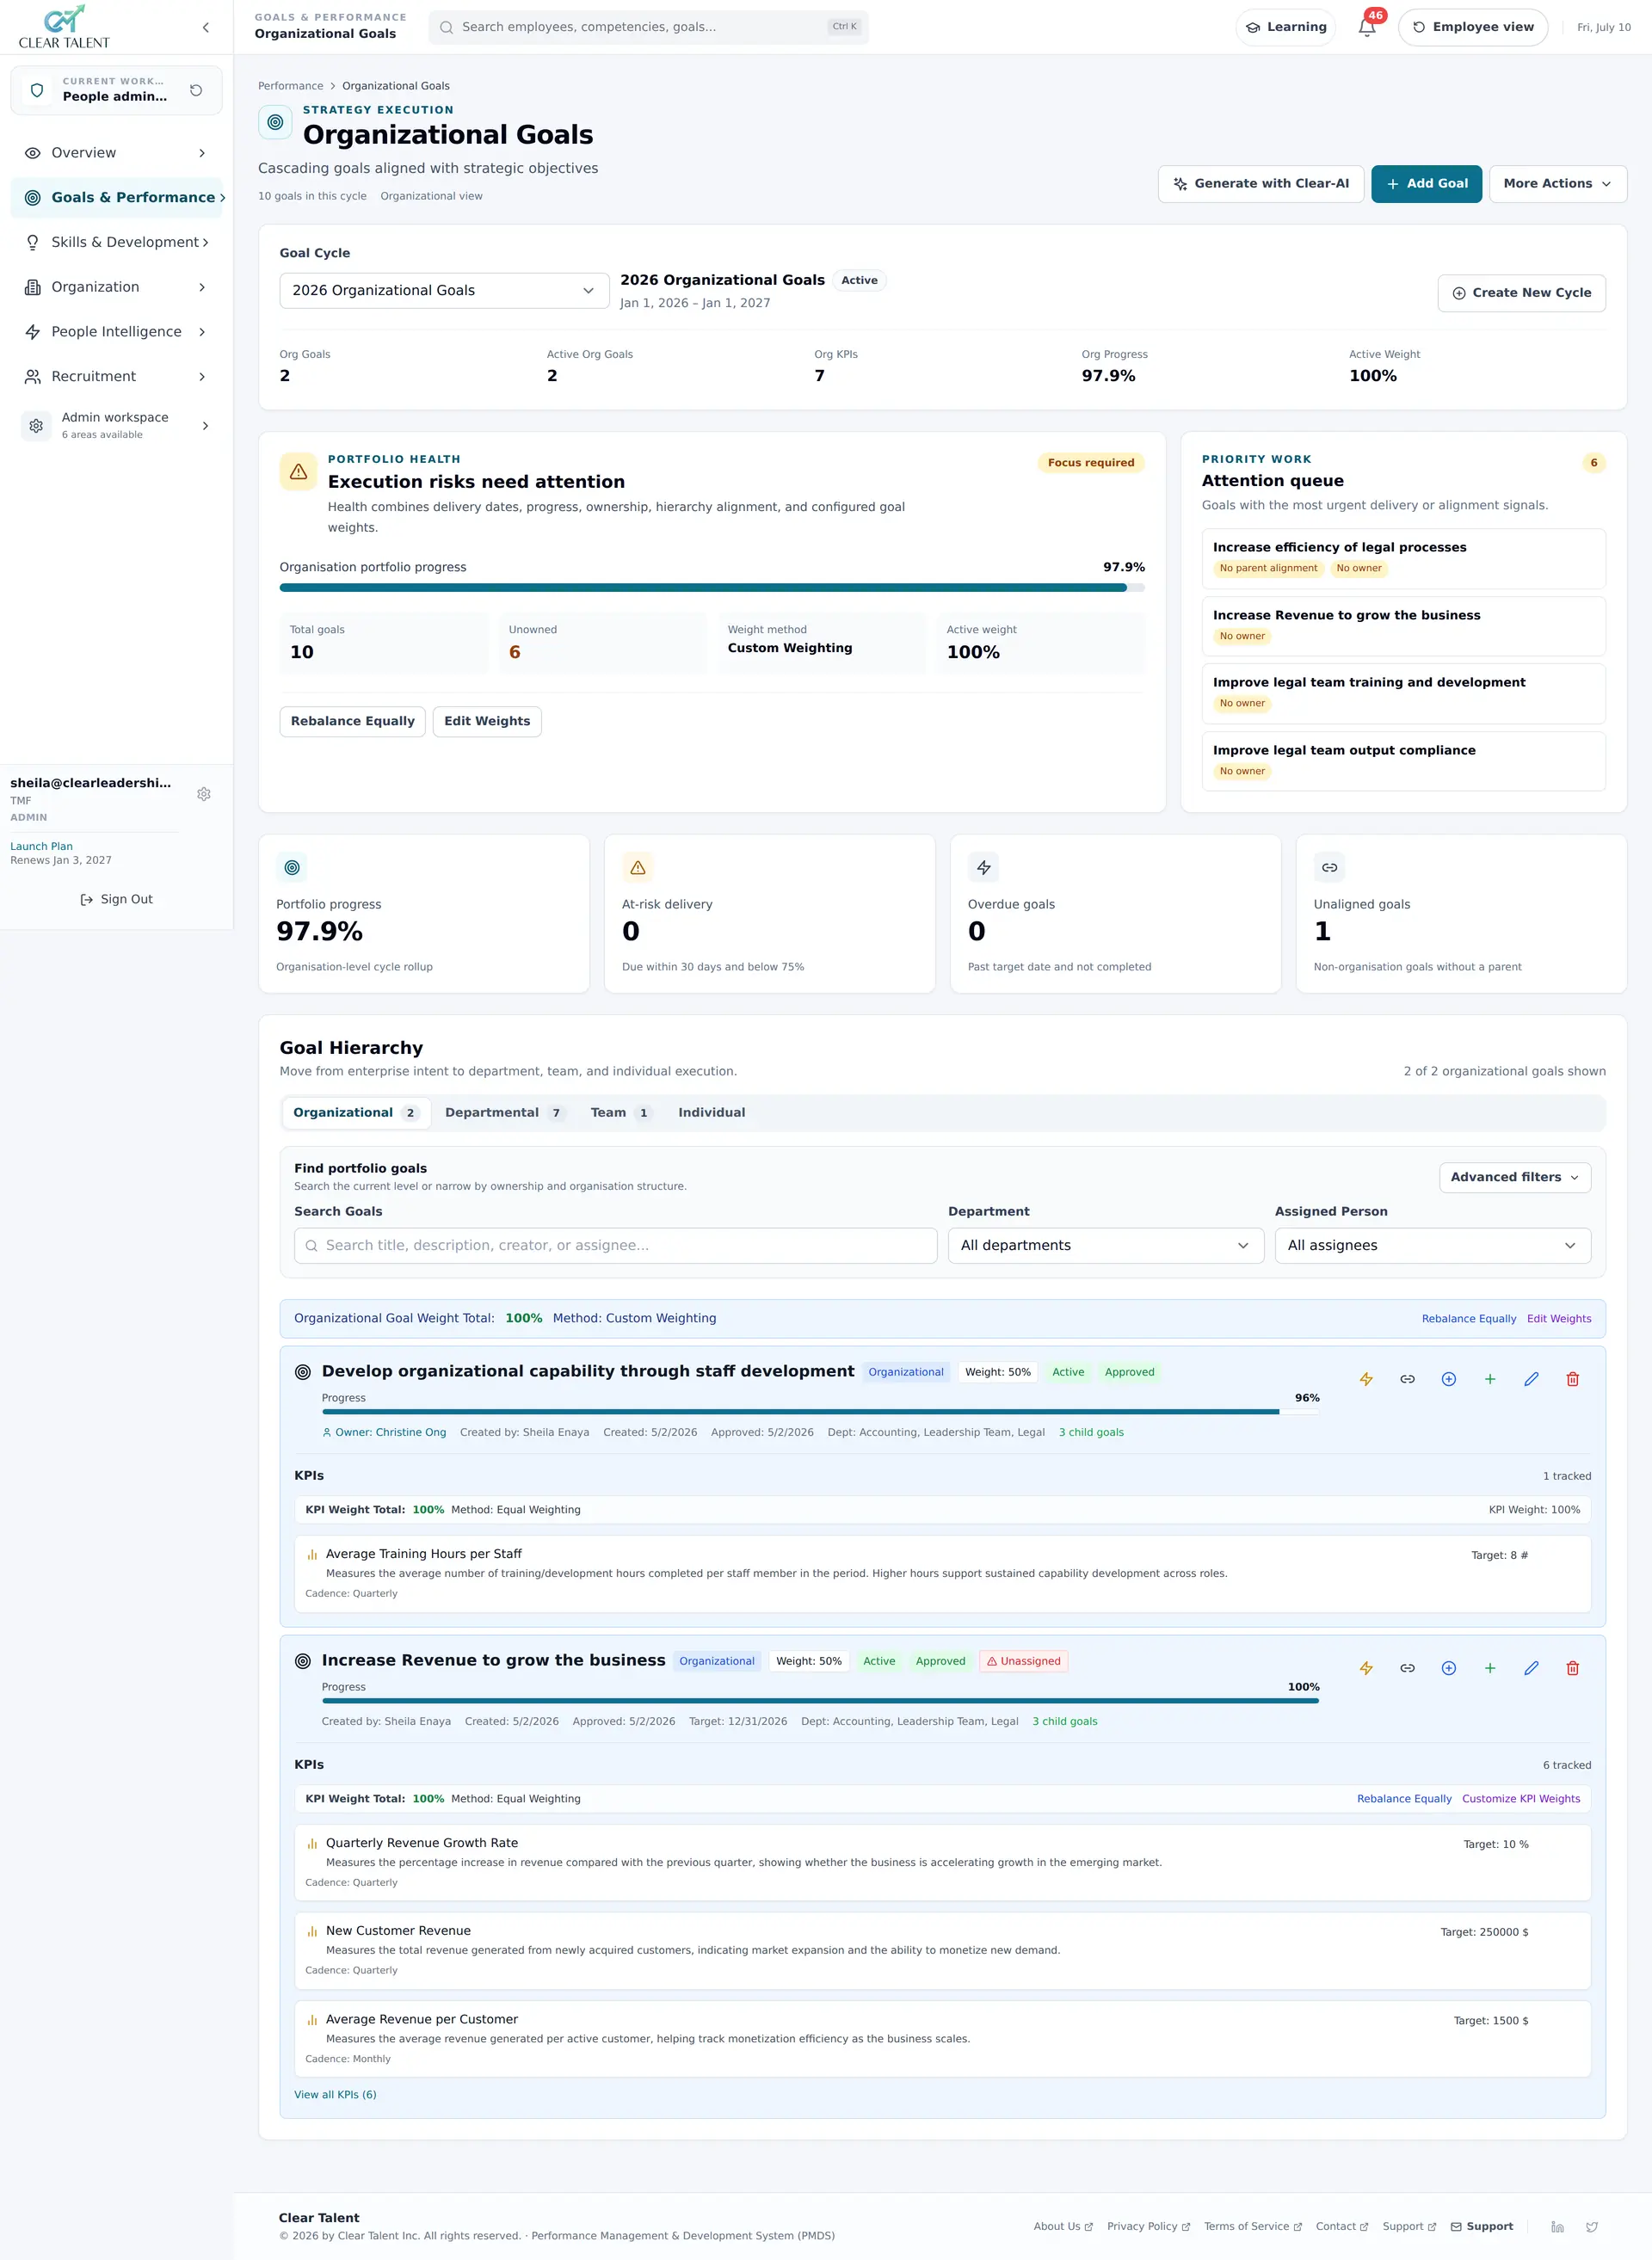
CLEAR Talent holds KPIs in a central library of reusable, role-aware templates, with performance bands and guardrails agreed centrally, so “exceeded target” means the same thing in sales as in support. Each person’s KPIs sit in a weighted portfolio whose weights count only active KPIs, evidence can be linked to each KPI result, and the goal alignment view flags KPIs not yet connected to any goal.
The balance between goals and KPIs on one side and competency assessment on the other is configurable per level. Goal scores roll into the performance review automatically, and each review cycle runs through self-review, 360° input and manager review to calibration and a final rating. Ava, the platform’s AI assistant, can draft KPIs and weightings for a role as a starting point to edit.
What no software will do is choose your KPIs for you. If you want to judge fit before a conversation, published plan prices are on the pricing page.
See CLEAR Talent’s OKR and goal-setting software and KPI library